Many computer sellers and most software vendors maintain helplines for customers. A random sample...

Many computer sellers and most software vendors maintain helplines for

customers. A random sample of the duration(in minutes) of technical support

calls to Hewlett-Packard was obtained, and the resulting stem-and-leaf plot is

given below.

0. 11223344555566678888999

1 . 0001222222335668999

2. 012334556678

3. 000123478

4 334468

5 125

6 15 Stem=tens

7 7 Leaf=ones

a. Describe the shape of this distribution of the duration of technical support

calls.

b. Use the plot to construct a frequency distribution using the class intervals

0-5, 5-10, 10-15, etc.

c. What proportion of support calls last less than 15 minutes?

d. If a call lasts at least 25 minutes, a supervisor monitors the conversation.

What proportion of calls were monitored?

Solved
STATISTICS 1 Answer Sahil Pratap Singh

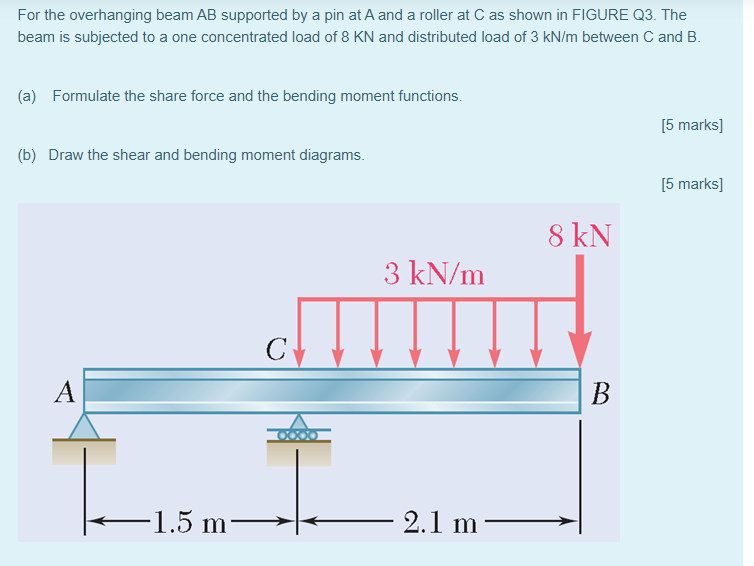
For the overhanging beam AB supported by a pin at A and a roller at C as shown in FIGURE Q3. The ...

For the overhanging beam AB supported by a pin at A and a roller at C as shown in FIGURE Q3. The beam is subjected to a one c

Solved
Civil Engineering 1 Answer Leanh Reyes

Literacy rate is a reflection of the educational facilities and quality of education available in...

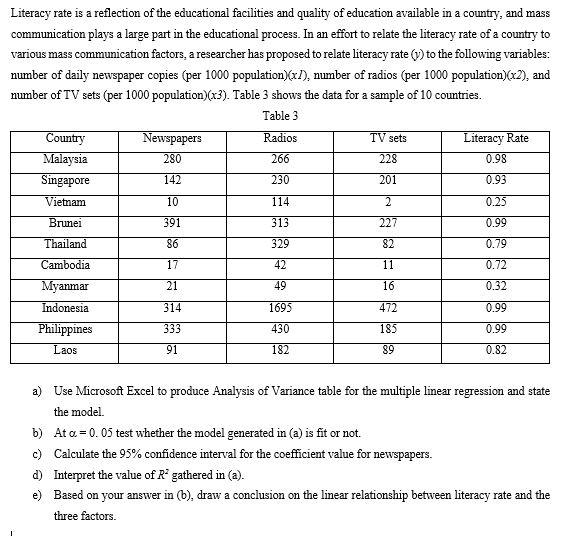
Literacy rate is a reflection of the educational facilities and quality of education available in a country, and mass communication plays a large part in the educational process. In an effort to relate the literacy rate of a country to various mass communication factors, a researcher has proposed to relate literacy rate (y) to the following variables: number of daily newspaper copies (per 1000 population)(x1), number of radios (per 1000 population)(x2), and number of TV sets (per 1000 population)(x3). Table 3 shows the data for a sample of 10 countries.

Table 3

Country

Newspapers

Radios

TV sets

Literacy Rate

Malaysia

280

266

228

0.98

Singapore

142

230

201

0.93

Vietnam

10

114

2

0.25

Brunei

391

313

227

0.99

Thailand

86

329

82

0.79

Cambodia

17

42

11

0.72

Myanmar

21

49

16

0.32

Indonesia

314

1695

472

0.99

Philippines

333

430

185

0.99

Laos

91

182

89

0.82

  1. Use Microsoft Excel to produce Analysis of Variance table for the multiple linear regression and state the model.
  2. At a = 0. 05 test whether the model generated in (a) is fit or not.
  3. Calculate the 95% confidence interval for the coefficient value for newspapers.
  4. Interpret the value of R2 gathered in (a).
  5. Based on your answer in (b), draw a conclusion on the linear relationship between literacy rate and the three factors.

Solved
STATISTICS 1 Answer Syed Yousuf Fatmi

Literacy rate is a reflection of the educational facilities and quality of education available in...

Literacy rate is a reflection of the educational facilities and quality of education available in a country, and mass communi

Solved
STATISTICS 1 Answer Charnisha Davis

A second semester class is studying the environment. One of the assignments is to grow bean plant...

A second semester class is studying the environment. One of the assignments is to grow bean plants in different soils. Ahmad chose to grow his bean plants in soil found outside his classroom mixed with dryer lint. Wong chose to grow her bean plants in potting soil bought at the local nursery. Lethmi chose to grow his bean plants in soil from his mother's garden. They were grown inside the classroom next to a large window. At the end of the growing period, each plant was measured, producing the data (in cm).

Table 2

Ahmad's Plants

Wong's Plants

Lethmi's Plants

24

21

23

30

23

25

31

23

20

-

23

27

22

30

20

  1. Construct a complete Analysis of Variance table.
  2. At a = 0.05, test whether the three soils in which the bean plants were grown produce the same mean height.

Solved
STATISTICS 1 Answer JUSTINE ICEL DEREJE

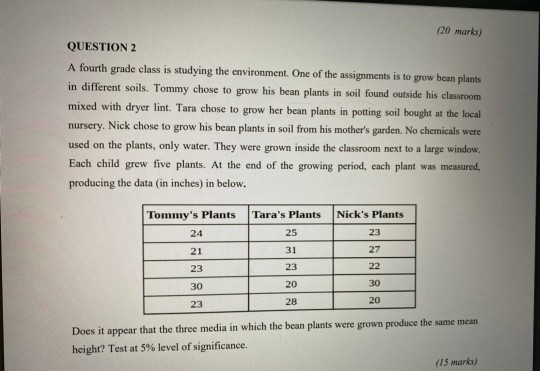
(20 marks) QUESTION 2 A fourth grade class is studying the environment. One of the assignments is...

(20 marks) QUESTION 2 A fourth grade class is studying the environment. One of the assignments is to grow bean plants in diff

Solved
STATISTICS 1 Answer Muhammad Anas

QUESTION 1 A swimming coach wants to know whether swimmers showed improvement in 100 meter...

QUESTION 1

A swimming coach wants to know whether swimmers showed improvement in 100 meters freestyle event after attending a central training camp. As such, 12 swimmers were selected at random and their times were recorded twice: best time before attending the training camp and best time after attending the training camp. The objective of the study is to see whether the times recorded are faster (lower) after attending the training camp as compared to before attending. The times recorded (in seconds) are shown in Table 1.

Table 1

Swimmer

Before

After

1

81.32

76.48

2

69.35

66.18

3

70.65

65.15

4

77.53

74.82

5

86.68

77.69

6

75.37

69.42

7

68.43

67.34

8

64.10

55.17

9

83.28

87.40

10

88.85

84.73

11

61.47

59.34

12

99.96

82.04

  1. Calculate the mean time difference after and before attending the training camp.
  2. Calculate the standard deviation time difference after and before attending the training camp.
  3. What assumptions should be made to conduct the hypothesis test?
  4. At a = 0.05, can you support the claim that the mean time after attending the training camp is lower as compared to before attending the training camp? Assume the population variances are equal.

[20 marks]

QUESTION 2

A second semester class is studying the environment. One of the assignments is to grow bean plants in different soils. Ahmad chose to grow his bean plants in soil found outside his classroom mixed with dryer lint. Wong chose to grow her bean plants in potting soil bought at the local nursery. Lethmi chose to grow his bean plants in soil from his mother's garden. They were grown inside the classroom next to a large window. At the end of the growing period, each plant was measured, producing the data (in cm).

Table 2

Ahmad's Plants

Wong's Plants

Lethmi's Plants

24

21

23

30

23

25

31

23

20

-

23

27

22

30

20

  1. Construct a complete Analysis of Variance table.
  2. At a = 0.05, test whether the three soils in which the bean plants were grown produce the same mean height.

QUESTION 3

Literacy rate is a reflection of the educational facilities and quality of education available in a country, and mass communication plays a large part in the educational process. In an effort to relate the literacy rate of a country to various mass communication factors, a researcher has proposed to relate literacy rate (y) to the following variables: number of daily newspaper copies (per 1000 population)(x1), number of radios (per 1000 population)(x2), and number of TV sets (per 1000 population)(x3). Table 3 shows the data for a sample of 10 countries.

Table 3

Country

Newspapers

Radios

TV sets

Literacy Rate

Malaysia

280

266

228

0.98

Singapore

142

230

201

0.93

Vietnam

10

114

2

0.25

Brunei

391

313

227

0.99

Thailand

86

329

82

0.79

Cambodia

17

42

11

0.72

Myanmar

21

49

16

0.32

Indonesia

314

1695

472

0.99

Philippines

333

430

185

0.99

Laos

91

182

89

0.82

  1. Use Microsoft Excel to produce Analysis of Variance table for the multiple linear regression and state the model.
  2. At a = 0. 05 test whether the model generated in (a) is fit or not.
  3. Calculate the 95% confidence interval for the coefficient value for newspapers.
  4. Interpret the value of R2 gathered in (a).
  5. Based on your answer in (b), draw a conclusion on the linear relationship between literacy rate and the three factors.

Solved
SCIENCE/MATH 1 Answer Brynner Elvis

A swimming coach wants to know whether swimmers showed improvement in 100 meters freestyle event ...

A swimming coach wants to know whether swimmers showed improvement in 100 meters freestyle event after attending a central training camp. As such, 12 swimmers were selected at random and their times were recorded twice: best time before attending the training camp and best time after attending the training camp. The objective of the study is to see whether the times recorded are faster (lower) after attending the training camp as compared to before attending. The times recorded (in seconds) are shown in Table 1.

Table 1

Swimmer

Before

After

1

81.32

76.48

2

69.35

66.18

3

70.65

65.15

4

77.53

74.82

5

86.68

77.69

6

75.37

69.42

7

68.43

67.34

8

64.10

55.17

9

83.28

87.40

10

88.85

84.73

11

61.47

59.34

12

99.96

82.04

  1. Calculate the mean time difference after and before attending the training camp.
  2. Calculate the standard deviation time difference after and before attending the training camp.
  3. What assumptions should be made to conduct the hypothesis test?
  4. At a = 0.05, can you support the claim that the mean time after attending the training camp is lower as compared to before attending the training camp? Assume the population variances are equal.

Solved
SCIENCE/MATH 1 Answer Leah Jane Aying

A 40.0 mL solution of 0.0400 M Hg2(NO3)2 was titrated with 60.0 mL of 0.100 M KI to precipitate H...

A 40.0 mL solution of 0.0400 M Hg2(NO3)2 was titrated with 60.0 mL of 0.100 M KI to precipitate Hg2I2 (Ksp = 4.6 x 10⁻²⁹).

a) What volume of KI is needed to reach the equivalence point?

b) Calculate the ionic strength of the solution when 60.0 mL of KI have been added.

c) Using activities, calculate pHg2+2 (= -log aHg2+2) for your answer in part (b).

Solved
Chemistry 1 Answer xd Rartie