2. Laboratory filtrations conducted at constant pressure drop on a slurry of Caco, in H20 gave th...
maybe you can use excel
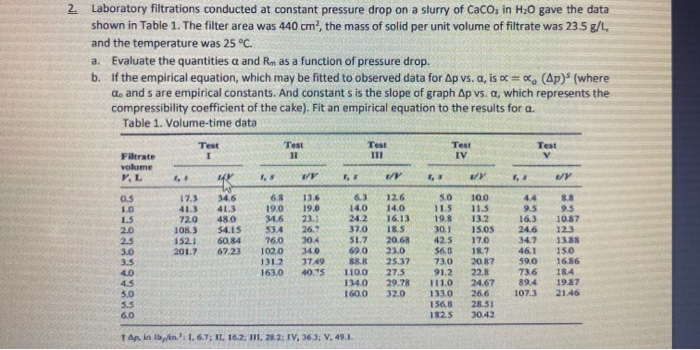
2. Laboratory filtrations conducted at constant pressure drop on a slurry of Caco, in H20 gave the data shown in Table 1. The filter area was 440 cm, the mass of solid per unit volume of filtrate was 23.5 g/L, and the temperature was 25 °C. a. Evaluate the quantities a and Rm as a function of pressure drop. b. If the empirical equation, which may be fitted to observed data for Ap vs. a, is 0 = 0%, (Ap)s (where A. and s are empirical constants. And constant s is the slope of graph Ap vs. a, which represents the compressibility coefficient of the cake). Fit an empirical equation to the results for a. Table 1. Volume-time data Test Test 11 Test TRI Test IV Test V Filtrate volume VL 1, / 17.3 720 1083 152.1 2017 0.5 10 1.5 2.0 25 3.0 3.5 4.0 45 5.0 5.5 6.0 34.6 41.3 480 54.15 60.84 67.23 19.0 34.6 534 760 1000 131.2 163.0 136 19.0 23.1 26.7 304 34.0 37.49 40.75 8.8 9.5 10.87 123 13.88 6.3 14.0 24.2 37.0 51.7 69.0 SRR 1100 134.0 160.0 12.6 14.0 16.13 18.5 20.68 23.0 25.37 27.5 29.78 32.0 150 5.0 11.5 19.8 30.1 42.5 56,0 73.0 91.2 111.0 133.0 1568 182.5 10.0 11.5 13.2 15.05 17.0 18.7 20.87 22.8 24.67 26.6 28.51 30.42 9.5 16.3 24.6 34.7 46.1 59.0 73.6 89.4 107.3 1686 18.4 19.87 21.46 Ar in lb, in: 1. 6.7: II. 16.2: III, 282; IV, 36,3; V. 49.1.
Solved
Chemical Engineering
1 Answer
Josh Deller
Login to view answer.